
BUSINESS
Inflation Outpaces Wage Growth as Gasoline Claims the Raise
Inflation at 3.4% outpaced 3.1% wage growth in August, shifting dollars to gasoline and warehouse clubs while real hourly pay fell 0.3%.

U.S. consumer prices rose 3.4% in the year through August while average hourly earnings rose 3.1%, the Bureau of Labor Statistics said on Sept. 11. Real hourly pay fell 0.3% after prices again outran the raise.
The 0.3-point gap looks small on a spreadsheet. It is already moving money. Gasoline took more than one-third of the August inflation rise, and households are steering grocery trips toward warehouse clubs and discounters as the leftover dollar shrinks.
A 0.3-Point Gap in the August Paycheck
Heather Long, chief economist at Navy Federal Credit Union, said a substantial number of Americans are worse off because incomes are not keeping up with prices. She has been tracking the wage-price race for a year. Until this spring, pay was slowly catching up. That run ended as energy costs jumped after the war in Iran.
The official ledger is blunt. Seasonally adjusted, real hourly earnings fell 0.3% from August 2025 to August 2026. Nominal hourly pay rose 0.3% in August, to $37.75, and 3.1% over the year, from $36.62. The Consumer Price Index for All Urban Consumers rose 0.4% on the month, enough to wipe out that raise and then some.
From July to August, real hourly earnings slipped 0.1%. Long’s line on the print was spare. “The basics are that inflation is wiping out wage gains,” she said.
THE AUGUST PAYCHECK LEDGER
| Measure | August change | 12-month change |
|---|---|---|
| CPI-U | +0.4% | +3.4% |
| Average hourly earnings | +0.3% | +3.1% |
| Real hourly earnings | -0.1% | -0.3% |
| Average weekly hours | +0.3% | +0.6% |
| Real weekly earnings | +0.2% | +0.3% |
Payrolls rose 162,000 in August and the unemployment rate held at 4.1%. That is not a wage-price spiral. Hourly pay is cooling even as the price of getting to work is not.
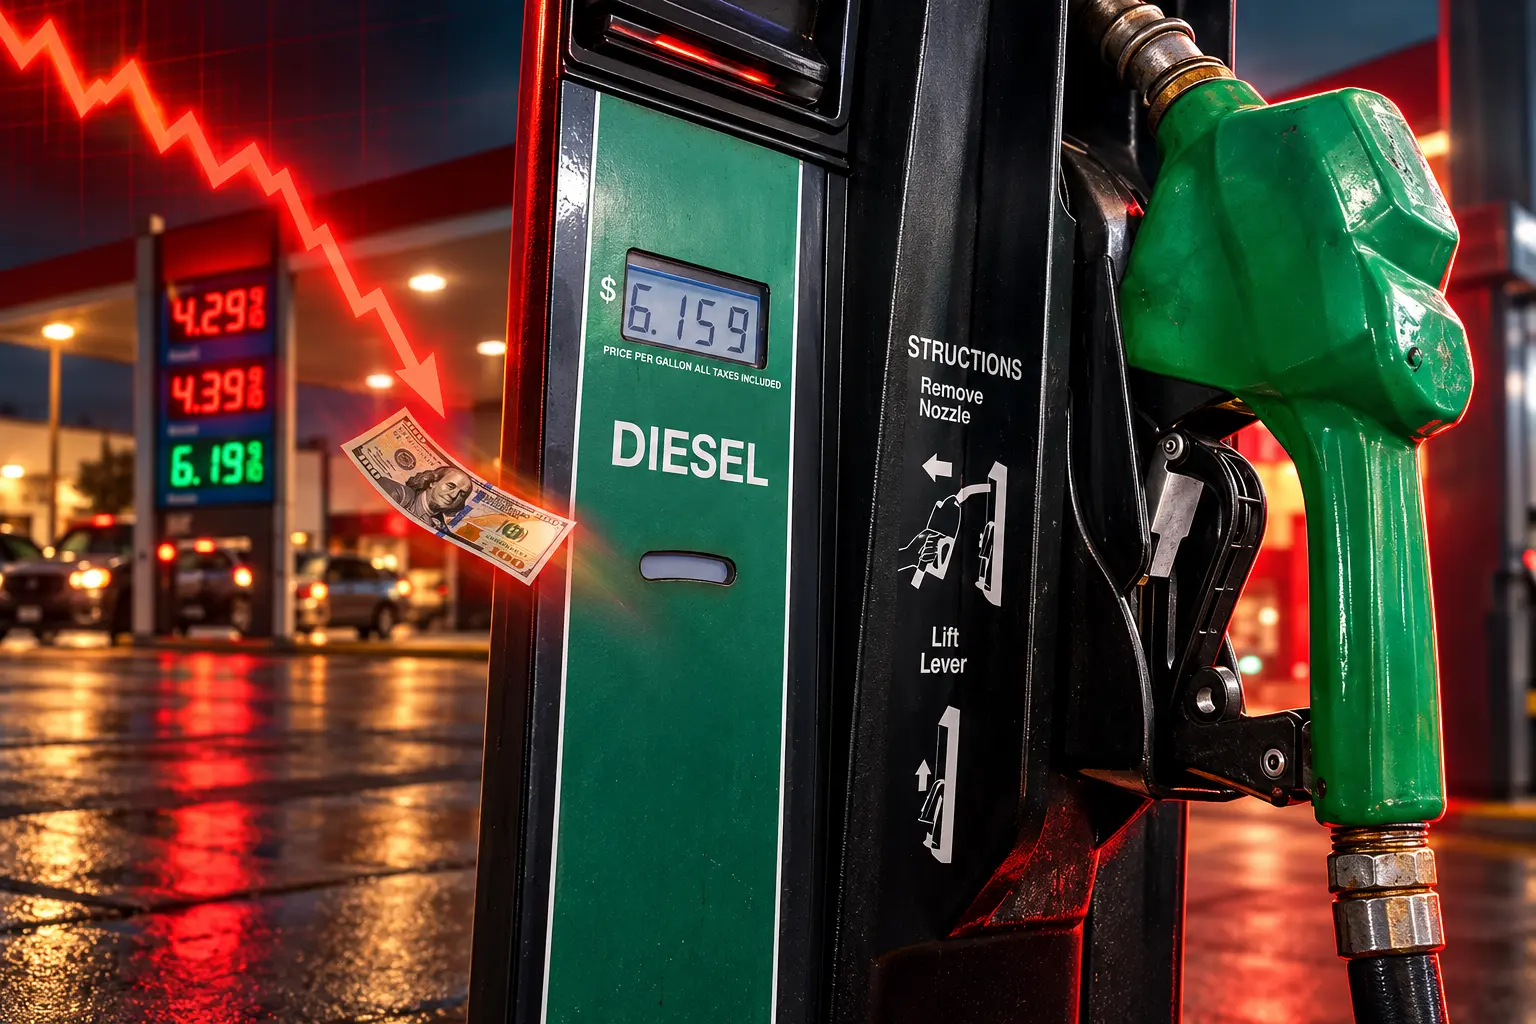
Gasoline Took More Than a Third of the Monthly Rise
Core prices, which strip out food and energy, rose 2.4% over the year and 0.3% in August. A 3.1% raise still beats that basket. The hole is in fuel. The gasoline index gasoline rose 3.9% in August on a seasonally adjusted basis, and the bureau said that move accounted for more than one-third of the monthly increase in the all-items index. Before seasonal adjustment, pump prices were up 2.5% on the month.
Over 12 months the split is even louder. Energy is up 16.3%. Gasoline is up 27.4%. Fuel oil is up 52.0%. Electricity rose 3.8% and utility gas 4.4%. Food, the item people talk about in checkout lines, rose 2.7%, with groceries up 2.2% and meals out up 3.4%. Shelter rose 3.0%.
THE AUGUST ENERGY BILL
- Monthly gasoline: The 3.9% seasonally adjusted jump supplied more than one-third of the 0.4% rise in the all-items index.
- Yearly gasoline: A 27.4% increase made motor fuel the largest single contributor to the 3.4% annual inflation rate.
- Share of CPI: The Bureau of Transportation Statistics said gasoline contributed 25.6% of inflation over the year, with all transportation accounting for 30.2% of the 3.4% rise.
- Airline fares: That index is up 23.4% over the year, another travel bill stacked on top of the pump.
Transportation prices overall rose 6.2% from August 2025 to August 2026, the transportation bureau said. The raise is not being lost in a broad overheat. It is being posted at the pump and at the airport.
A rate increase cannot drill a well or reopen a shipping lane. It can make the next car loan and the next credit-card balance more expensive while real hourly pay is already falling. That is a second tax on the same paycheck, levied after fuel has taken the first cut.
From May 2023 Until the Iran Shock
Long first built her wage-versus-inflation chart to show the opposite story. From May 2023 until about April 2026, wage growth had generally run ahead of prices. Workers were still angry about the higher level of prices, she said, but the gap was closing. “That’s what’s just hard to watch. Things were getting better, and now that improvement has blown up,” she said.
The blow-up is dated. In March, the gasoline index jumped 21.2% on a seasonally adjusted basis and the energy index jumped 10.9%. June offered a pause, with the all-items index down 0.4% as energy fell 5.7%. July was quiet. August put fuel back in charge.
WHEN PAY STOPPED BEATING PRICES
- May 2023: Wage growth begins a long stretch of running ahead of inflation, the period Long later marked as the catch-up.
- March 2026: Gasoline rises 21.2% on the month and Navy Federal’s car-cost index hits a record as the Iran war shocks energy markets.
- April 2026: Long dates the turning point, after nearly three years in which pay had generally beaten prices.
- June 2026: Headline prices fall 0.4% as energy drops 5.7%, a brief window that does not hold.
- August 2026: CPI-U is up 3.4% over the year, hourly pay is up 3.1%, and real hourly earnings are down 0.3%.
- Sept. 11, 2026: The bureau publishes both reports, locking in the 0.3-point gap.
The March 2026 TED note from the bureau still showed real hourly earnings up 0.3% over the year ended in March, the last clean print of the catch-up. Five months later that line is below zero.
Costco, Walmart, and the Stretch-Every-Dollar Shift
Personal consumption was 68.0% of GDP in the second quarter, according to Bureau of Economic Analysis figures compiled by the Federal Reserve Bank of St. Louis. When that slice of the economy trades down, the stores that catch the traffic win, and the stores that lose the basket feel it twice.
YouGov’s grocery profiles, built on responses from June 2025 through June 2026, split the aisle by income. The firm treats households earning at least $150,000 as higher-income, about 10% of the population. Costco is where that group is most likely to do most of its grocery shopping. Walmart Supercenter is where middle- and lower-income households land.
WHERE THE GROCERY TRIP IS GOING
- Costco: Primary store for 11% of higher-income shoppers, versus 5% of middle- and lower-income shoppers.
- Walmart Supercenter: Primary store for 20% of middle- and lower-income shoppers, versus 8% of higher-income shoppers.
- Walmart (standard): Primary store for 12% of middle- and lower-income shoppers, versus 4% of higher-income shoppers.
- Aldi: Primary store for 6% of higher-income shoppers, sitting on the same value shelf as the warehouse club.
- Weekly spend: 51% of higher-income households report spending more than $150 a week on groceries, versus 28% of other households.
Navy Federal’s internal card data, covering about 15 million members, shows the same slide into warehouses and discounters, Long said, and it is showing up almost across the income spectrum. “People who used to shop at Whole Foods are now at Costco, Aldi, and so you can see that people are still really trying to stretch every dollar,” she said.
That is the other half of the transfer. Fuel takes the raise. The grocery run that remains goes to the retailer that sells bulk and private label. Premium banners keep the reputation. Value banners keep the ticket.
Why Real Weekly Pay Still Rose
The hourly loss is not the whole paycheck. Real average weekly earnings rose 0.3% over the year and 0.2% in August. The workweek is the plug. Average weekly hours rose from 34.2 in August 2025 to 34.4 in August 2026, a 0.6% gain, and they rose 0.3% on the month.
Do the arithmetic and the two series fit. A 0.3% drop in real hourly pay, times a 0.6% longer week, is a 0.3% rise in real weekly pay. Households did not recover purchasing power on the rate they earn. They recovered it by staying on the clock.
For production and nonsupervisory employees, the hourly picture is a little less ugly and the weekly picture is a little worse. Real hourly earnings in that group fell 0.1% over the year and 0.1% in August. Real weekly earnings fell 0.1% on the month, because their workweek did not lengthen in August.
The consensus story is that the paycheck shrank. The books say the hourly rate shrank and the week got longer. Time is the hidden payment, and it does not show up in a Costco receipt.
Car Costs Have Outrun Wages Since 2020
The squeeze did not start in August. On April 13, Navy Federal said car ownership costs hit a record in March. Its Cost of Car Ownership index, built from 11 Bureau of Labor Statistics series, rose 4.7% that month, 5.5% over the year, and 47.6% since January 2020. Wages, Long said then, were up 31.5% over the same span from 2020, a 16.1-point gap.
The Cost of Car Ownership Index soared to a record high in March, underscoring the squeeze so many Americans are facing financially right now. The 21% jump in gas prices in March was the largest factor leading to the new all-time high, but maintenance costs, repair costs and tires were all up around 1% as well during the month.
Heather Long, chief economist, Navy Federal Credit Union
She added that ending the war in Iran and reopening the Strait of Hormuz were the only realistic ways to ease those costs in 2026. August did not deliver that easing. The transportation bureau said regular gasoline averaged $4.06 a gallon in August, up 3.2% from July and 29.5% from a year earlier, and August diesel averaged $5.46 a gallon, up 10.2% on the month and 45.9% on the year. Diesel then touched $6 a gallon on Sept. 11, a new high, as supply trouble from the wars in Iran and Ukraine fed through the rack.
West Coast regular averaged $5.13 in August. The Gulf Coast, the cheap region, still averaged $3.61, up 32.9% from a year earlier. Geography changes the level. It does not change the direction.
Long’s Miserable Tie at the Start of 2027
Long does not see a fast way back to the 2023-26 catch-up. Geopolitics is still in the price of fuel, and wage growth is slowing, not reaccelerating. She said it is going to be tough for a long time. Her best case is that wage growth and inflation meet again around the beginning of 2027.
But that’s still going to feel pretty miserable on Main Street if inflation equals wage growth.
Heather Long, chief economist, Navy Federal Credit Union
A tie at 3% would stop the hourly loss. It would not reverse the 27.4% gasoline bill, the 47.6% rise in car-ownership costs since 2020, or the shoppers who already left Whole Foods for Costco and Aldi. Those tickets have already changed hands.
The August print leaves workers supplying more hours, fuel suppliers collecting a quarter of the inflation bill, and discount grocers ringing up the trade-down. If pay and prices only draw even next year, that split is the part that lasts.

Musk Blames Indian Oligarchs While Starlink Waits in Line

France Extends Its Soda Tax to Packaged Biscuits and Cereal

Hormel Bets $1.055 Billion on Brakebush Restaurant Chicken

Hyundai Bets the 2027 Tucson on Hybrids, Not Plugs

Anthropic Chases a $2 Trillion Listing Before Thanksgiving

EIF’s €30 Million Pushes Nordic Foodtech Close to €80 Million

AI Agents Can Act, but Someone Has to Own Them

Bass Persuades Puts Miley Back at No. 1 on Sales

Ocarina of Time’s Australia Listing Matches Yoshi at $59.99

Newark’s Phone Ban Starts as a Storage Problem
-
 BUSINESS1 month ago
EIF’s €30 Million Pushes Nordic Foodtech Close to €80 Million
-
 NEWS1 month ago
AI Agents Can Act, but Someone Has to Own Them
-
 ENTERTAINMENT3 weeks ago
Bass Persuades Puts Miley Back at No. 1 on Sales
-
 GAMING1 month ago
Ocarina of Time’s Australia Listing Matches Yoshi at $59.99
-
 NEWS1 month ago
Newark’s Phone Ban Starts as a Storage Problem
-

 NEWS1 month ago
LG Smart TVs Still Scan Homes Behind Apple TV
-

 NEWS1 month ago
Sembly 3.0 Makes Branded Decks and Shifts the Bottleneck
-

 NEWS1 month ago
Cheaper Tokens Made AI Deployments Cost Enterprises More