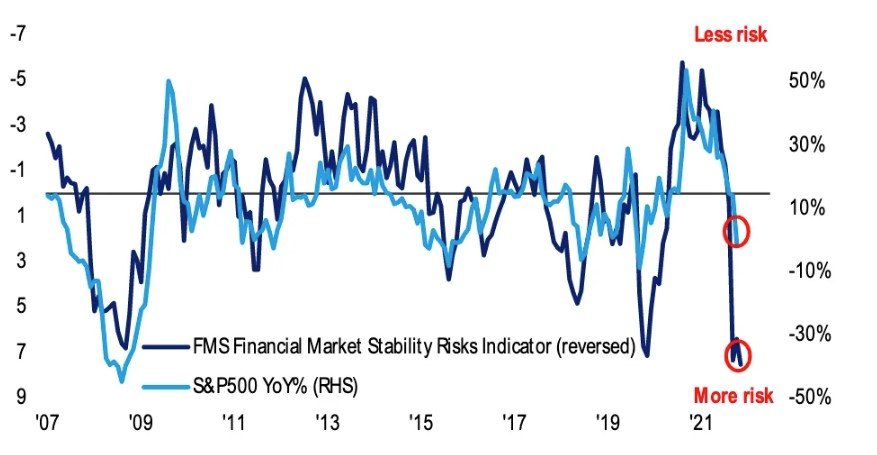
Yahoo Finance has released its first edition of the Chartbook, a collection of 50 charts that tell the story about the markets and the economy right now. The Chartbook covers a wide range of topics, from the impact of the pandemic and the stimulus, to the trends in inflation, growth, employment, housing, consumer spending, and more. The Chartbook also features insights from some of the leading experts in the financial industry, such as Julian Emanuel from Evercore ISI, Rick Rieder from BlackRock, and Liz Ann Sonders from Charles Schwab. Here are some of the highlights from the Chartbook.

Money delivered during pandemic is still supporting the economy
One of the most striking charts in the Chartbook shows how the money supply (M2) has surged above its pre-COVID trendline due to the massive government stimulus in 2020, 2021, and part of 2022. Julian Emanuel from Evercore ISI explains that despite the recent contraction in M2 due to the tightening of monetary policy by the Federal Reserve, the economy has remained supported by the excess liquidity that was injected during the pandemic. He says that this has kept the consumer strong and employment robust.
Remarkable surge in private R&D investment
Another chart that caught our attention shows how private investment in research and development (R&D) has increased significantly as a percentage of GDP since 2010. Rick Rieder from BlackRock argues that this is a sign of the long-term trajectory of growth and innovation in the US economy. He says that while inflation is a valid concern, it is often overlooked and underestimated how much R&D spending can boost productivity and competitiveness.
Consumer confidence is diverging from consumer spending
One of the themes that emerges from the Chartbook is that consumer confidence is not matching up with consumer spending. Liz Ann Sonders from Charles Schwab points out that while consumer confidence has rebounded sharply from its pandemic lows, it is still below its pre-COVID levels. On the other hand, consumer spending has surged above its pre-COVID trendline, fueled by the stimulus checks and the pent-up demand. She says that this divergence could pose a risk for future consumption if confidence does not catch up with spending.
Housing market is cooling off after a hot streak
The Chartbook also provides some insights into the state of the housing market, which has been one of the bright spots of the economic recovery. However, there are signs that the housing market is cooling off after a hot streak. The Chartbook shows how home sales have declined from their peak levels in late 2020 and early 2021, as well as how home price appreciation has slowed down in recent months. The Chartbook also shows how mortgage rates have risen above 7% at times, making housing less affordable for many buyers.
Stock market is defying expectations with a rebound rally
Finally, the Chartbook offers some perspective on the performance of the stock market, which has defied expectations with a rebound rally after a challenging year in 2022. The Chartbook shows how the S&P 500 index has gained more than 20% year-to-date, reaching new record highs. The Chartbook also shows how some of the sectors that were hit hard by the pandemic, such as energy and financials, have outperformed this year, while some of the sectors that benefited from the pandemic, such as technology and health care, have lagged behind.
These are just some of the highlights from the Yahoo Finance Chartbook. To see all 50 charts and read more insights from the experts, you can visit Yahoo Finance or click on this link.
